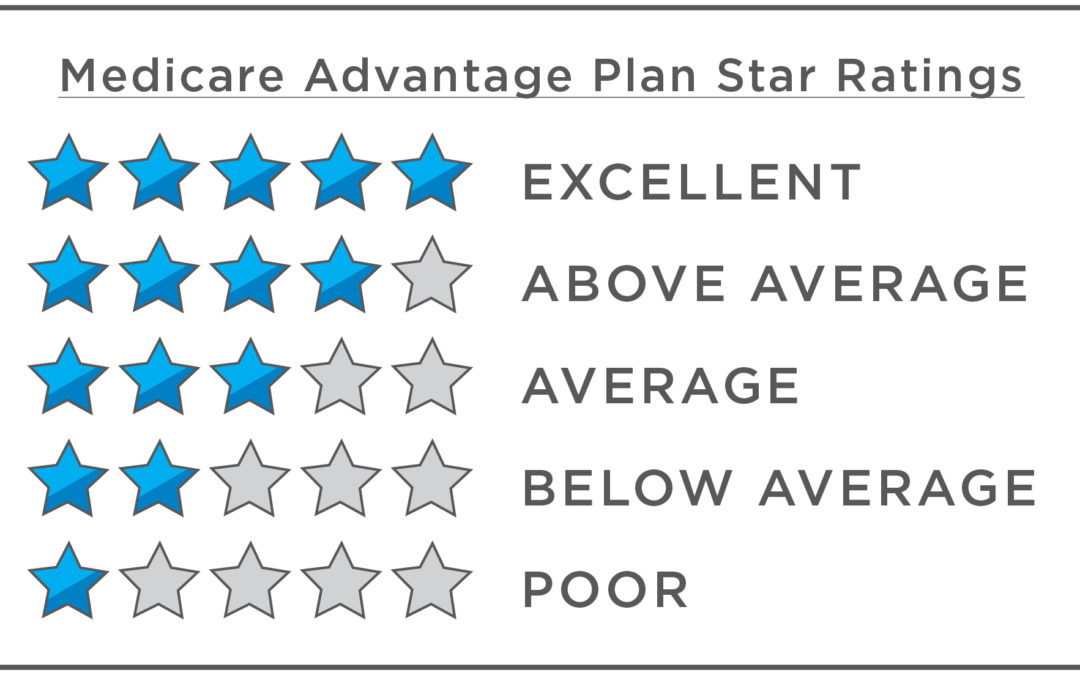
CMS created the Star Ratings system in 2008 to help seniors compare quality and performance among Medicare Advantage (MA) Part C plans and Part D prescription drug plans (PDPs). Insurance companies also benefit, as a plan’s star rating influences patients and directly affects membership growth. In 2012, CMS upped the ante by linking premiums and bonus payments to each plan’s star rating. Roughly, each half-star change in a plan’s rating affects bonus revenue by 25-30%, with the most significant reductions occurring when a plan drops under 4 stars. In real dollars, a plan increasing their star rating from 3.5 to 4.0 would result in double the annual bonus payment (referred to as a “rebate percentage”). Bonus payments are substantial, with an average amount between $700 – $1,000 per patient per year.
These bonus payments constitute the plan’s value payments to the providers and incentivize providers to increase their MA panels. The current MA provider payment models are basically fee-for-service with a star quality bonus, but the MA alignment of payment and quality is driving more provider groups to hunt for capitated MA opportunities. In these models, the providers keep a larger portion of the star-based rebate percentage as well as the 5% increase in revenue for a 4.0 – 5.0-star rating.
Of course, these windfall financial opportunities need to be weighed against the downside risk pressure of cost increases, star rating misses and inattention to risk scoring. With the MA premiums being relatively large compared to their commercial and Medicaid counterparts, there is a larger buffer for misses.
This revenue is not a handout – it requires work besides just “seeing” patients. The organization must have a strategy to win, a change process when the numbers are going in the wrong direction, and a mindset of transformation at the provider level. This year, the star rating scale is calculated based on a weighted average of 45 unique measures in 9 domains, five for part C and four for part D. The domain categories and weights (in parenthesis) rate outcomes (3), intermediate outcomes (3), patient experience and complaints (1.5), access (1.5), and process (1).
For more information on the specific measures, please click here. Need help building your Medicare Advantage strategy? Contact Dave Weathington, Continuum VP of Provider Strategies, at dweathington@continuumhealth.net or (856) 782-3300 x2602.


